Population Change 2020-2021
ACS Data
Part 1 of this notebook demonstrates how to query and merge the same data set from different years. It also demonstrates how, behind the scenes, censusdis loads metadata and works across multiple years. Nothing is hard-coded in the library about what variables or data sets are available in what years. So when the 2021 data was published, this notebook just worked.
However, it also demonstrates some issues one must be keenly aware of when looking at ACS data. ACS5 data covers a wide range of variables, but it also computes representative numbers over a five year time period, not numbers as of a specific data as some other data sets do. So the values presented in the 2020 data set are based on survey results from 2016, 2017, 2018, 2019, and 2020. If we compare 2021 ACS5 to 2020 ACS5, 4/5 of the sample comes from 2017, 2018, 2019 and 2020 in both. In the 2020 data set, there is also data from 2016, whereas in the 2021 data set there is also data from 2021.
PEP Data
Part 2 looks at the Population Estimates (PEP) data set, which seeks to estimate population at a specific point in time, specifically June 1 of each year. It also tracks changes from the previous year in both numeric and percentage terms.
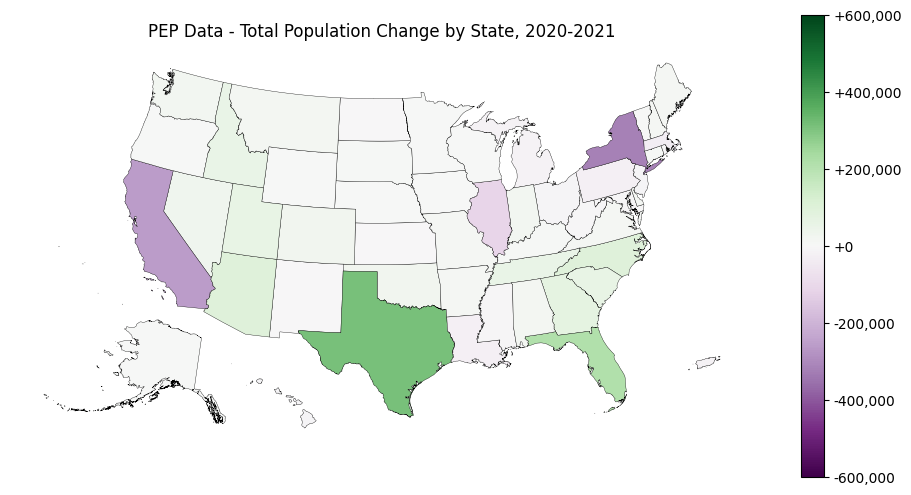
As we can see by comparing the data and maps in parts 1 and 2, it is important to understand not just what was measured in each data set, but how. Look at the difference in New York State for a particularly extreme difference based on which data set we look at.
[1]:
# So we can run from within the censusdis project and find the packages we need.
import os
import sys

sys.path.append(
    os.path.join(os.path.abspath(os.path.join(os.path.curdir, os.path.pardir)))
)
Imports and configuration
[2]:
import censusdis.data as ced
import censusdis.maps as cem

from censusdis.states import STATE_NY
Part 1: Using ACS5 Data
[3]:
DATASET_ACS5 = "acs/acs5"
[4]:
TOTAL_POPULATION_VARIABLE = "B01003_001E"
[5]:
gdf_states_2020 = ced.download(
    DATASET_ACS5,
    2020,
    ["NAME", TOTAL_POPULATION_VARIABLE],
    state="*",
    with_geometry=True,
)

# Note that we don't load the geometry here.
# We already have it above, and it will
# still be available after the merge.
df_states_2021 = ced.download(
    DATASET_ACS5, 2021, ["NAME", TOTAL_POPULATION_VARIABLE], state="*"
)
[6]:
gdf_both_years = gdf_states_2020.merge(
    df_states_2021, on=["STATE", "NAME"], suffixes=("_2020", "_2021")
)
[7]:
TOTAL_POPULATION_2020_VARIABLE = f"{TOTAL_POPULATION_VARIABLE}_2020"
TOTAL_POPULATION_2021_VARIABLE = f"{TOTAL_POPULATION_VARIABLE}_2021"

TOTAL_POPULATION_CHANGE = f"{TOTAL_POPULATION_VARIABLE}_DELTA"
TOTAL_POPULATION_CHANGE_PERCENT = f"{TOTAL_POPULATION_CHANGE}_PERCENT"
[8]:
gdf_both_years[TOTAL_POPULATION_CHANGE] = (
    gdf_both_years[TOTAL_POPULATION_2021_VARIABLE]
    - gdf_both_years[TOTAL_POPULATION_2020_VARIABLE]
)

gdf_both_years[TOTAL_POPULATION_CHANGE_PERCENT] = (
    100
    * gdf_both_years[TOTAL_POPULATION_CHANGE]
    / gdf_both_years[TOTAL_POPULATION_2020_VARIABLE]
)
Absolute
[9]:
gdf_both_years.sort_values(TOTAL_POPULATION_CHANGE, ascending=False)[
    ["NAME", TOTAL_POPULATION_CHANGE]
].head()
[9]:
| NAME | B01003_001E_DELTA | |
|---|---|---|
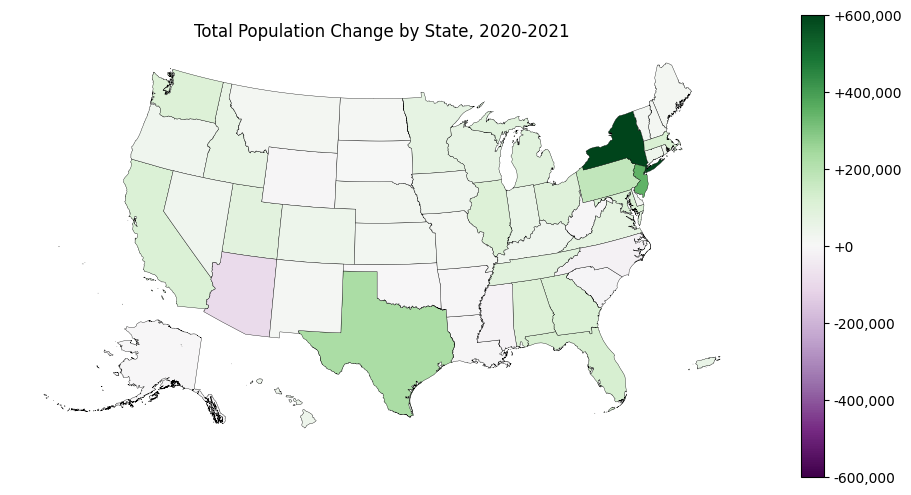
| 4 | New York | 599896 |
| 29 | New Jersey | 348606 |
| 24 | Texas | 227139 |
| 0 | Pennsylvania | 175765 |
| 7 | Florida | 122838 |
Percentagewise
[10]:
gdf_both_years.sort_values(TOTAL_POPULATION_CHANGE_PERCENT, ascending=False)[
    ["NAME", TOTAL_POPULATION_CHANGE_PERCENT]
].head()
[10]:
| NAME | B01003_001E_DELTA_PERCENT | |
|---|---|---|
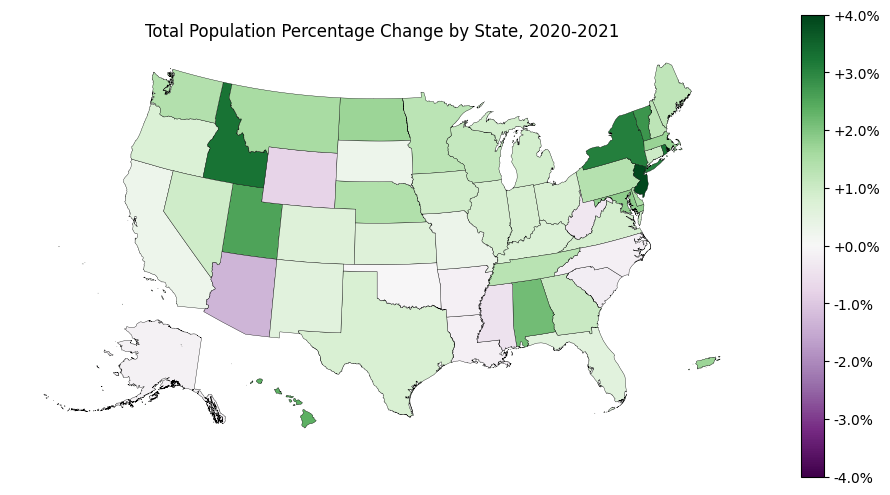
| 29 | New Jersey | 3.923349 |
| 19 | Idaho | 3.263285 |
| 42 | Rhode Island | 3.228499 |
| 4 | New York | 3.074049 |
| 32 | Vermont | 2.770446 |
Fastest shrinking states
Absolute
[11]:
gdf_both_years.sort_values(TOTAL_POPULATION_CHANGE, ascending=True)[
    ["NAME", TOTAL_POPULATION_CHANGE]
].head()
[11]:
| NAME | B01003_001E_DELTA | |
|---|---|---|
| 16 | Arizona | -94861 |
| 33 | North Carolina | -19205 |
| 5 | District of Columbia | -18820 |
| 39 | Mississippi | -14812 |
| 8 | South Carolina | -12614 |
Percentagewise
[12]:
gdf_both_years.sort_values(TOTAL_POPULATION_CHANGE_PERCENT, ascending=True)[
    ["NAME", TOTAL_POPULATION_CHANGE_PERCENT]
].head()
[12]:
| NAME | B01003_001E_DELTA_PERCENT | |
|---|---|---|
| 5 | District of Columbia | -2.681011 |
| 16 | Arizona | -1.322277 |
| 15 | Wyoming | -0.809670 |
| 39 | Mississippi | -0.496741 |
| 2 | West Virginia | -0.352822 |
Plot on maps
[13]:
from matplotlib.ticker import FuncFormatter

ax = cem.plot_us(
    gdf_both_years,
    TOTAL_POPULATION_CHANGE,
    legend=True,
    figsize=(12, 6),
    cmap="PRGn",
    edgecolor="black",
    linewidth=0.25,
    vmin=-600_000,
    vmax=600_000,
    legend_kwds={"format": FuncFormatter(lambda x, pos: f"{x:+,.0f}")},
)

ax.axis("off")
ax.set_title("Total Population Change by State, 2020-2021")
[13]:
Text(0.5, 1.0, 'Total Population Change by State, 2020-2021')
[14]:
ax = cem.plot_us(
    gdf_both_years,
    TOTAL_POPULATION_CHANGE_PERCENT,
    legend=True,
    figsize=(12, 6),
    cmap="PRGn",
    edgecolor="black",
    linewidth=0.25,
    vmin=-4,
    vmax=4,
    legend_kwds={"format": FuncFormatter(lambda x, pos: f"{x:+.1f}%")},
)

ax.axis("off")
ax.set_title("Total Population Percentage Change by State, 2020-2021")
[14]:
Text(0.5, 1.0, 'Total Population Percentage Change by State, 2020-2021')
Part 2: Using the Population Estimates Dataset
Instead of using two different years of the ACS5 data set, we could also use a specialized U.S. Census Data Set that estimates population and population change. It is called pep/population and is described at https://api.census.gov/data/2021/pep/population.html.
[15]:
DATASET_PEP = "pep/population"
[16]:
# See https://api.census.gov/data/2021/pep/population/variables.html

POP_2020_VARIABLE = "POP_2020"
POP_2021_VARIABLE = "POP_2021"
NUM_CHANGE_VARIABLE = "NPOPCHG_2021"
PCT_CHANGE_VARIABLE = "PPOPCHG_2021"

PEP_VARIABLES = [
    "NAME",
    POP_2020_VARIABLE,
    POP_2021_VARIABLE,
    NUM_CHANGE_VARIABLE,
    PCT_CHANGE_VARIABLE,
]
[17]:
gdf_pep = ced.download(DATASET_PEP, 2021, PEP_VARIABLES, state="*", with_geometry=True)
Absolute
[18]:
gdf_pep[["NAME", NUM_CHANGE_VARIABLE]].sort_values(
    NUM_CHANGE_VARIABLE, ascending=False
).head()
[18]:
| NAME | NPOPCHG_2021 | |
|---|---|---|
| 10 | Texas | 310288 |
| 40 | Florida | 211196 |
| 45 | Arizona | 98330 |
| 15 | North Carolina | 93985 |
| 25 | Georgia | 73766 |
Percentagewise
[19]:
gdf_pep[["NAME", PCT_CHANGE_VARIABLE]].sort_values(
    PCT_CHANGE_VARIABLE, ascending=False
).head()
[19]:
| NAME | PPOPCHG_2021 | |
|---|---|---|
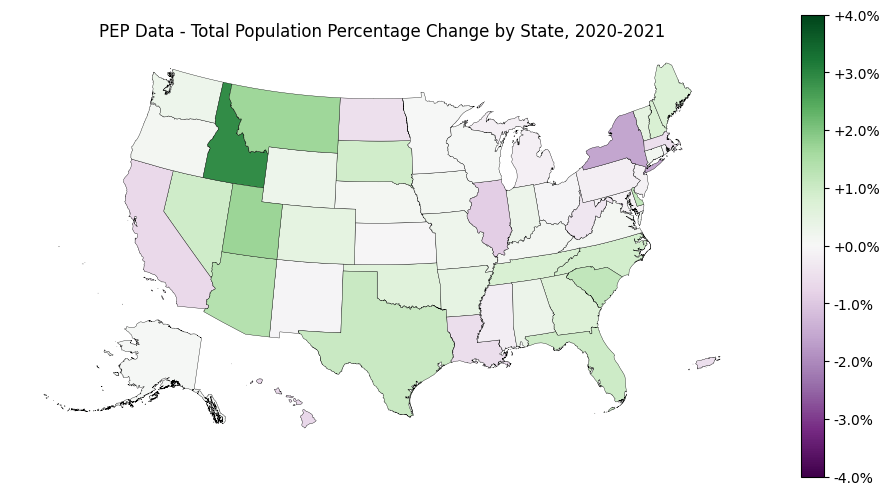
| 34 | Idaho | 2.876491 |
| 46 | Utah | 1.715308 |
| 36 | Montana | 1.664345 |
| 45 | Arizona | 1.369883 |
| 17 | South Carolina | 1.168957 |
Fastest shrinking states
Absolute
[20]:
gdf_pep[["NAME", NUM_CHANGE_VARIABLE]].sort_values(
    NUM_CHANGE_VARIABLE, ascending=True
).head()
[20]:
| NAME | NPOPCHG_2021 | |
|---|---|---|
| 37 | New York | -319020 |
| 19 | California | -261902 |
| 43 | Illinois | -113776 |
| 42 | Massachusetts | -37497 |
| 21 | Louisiana | -27156 |
Percentagewise
[21]:
gdf_pep[["NAME", PCT_CHANGE_VARIABLE]].sort_values(
    PCT_CHANGE_VARIABLE, ascending=True
).head()
[21]:
| NAME | PPOPCHG_2021 | |
|---|---|---|
| 9 | District of Columbia | -2.904391 |
| 37 | New York | -1.582838 |
| 43 | Illinois | -0.889901 |
| 2 | Hawaii | -0.713405 |
| 19 | California | -0.663047 |
Plot on maps
[22]:
from matplotlib.ticker import FuncFormatter

ax = cem.plot_us(
    gdf_pep,
    NUM_CHANGE_VARIABLE,
    legend=True,
    figsize=(12, 6),
    cmap="PRGn",
    edgecolor="black",
    linewidth=0.25,
    vmin=-600_000,
    vmax=600_000,
    legend_kwds={"format": FuncFormatter(lambda x, pos: f"{x:+,.0f}")},
)

ax.axis("off")
ax.set_title("PEP Data - Total Population Change by State, 2020-2021")
[22]:
Text(0.5, 1.0, 'PEP Data - Total Population Change by State, 2020-2021')
[23]:
ax = cem.plot_us(
    gdf_pep,
    PCT_CHANGE_VARIABLE,
    legend=True,
    figsize=(12, 6),
    cmap="PRGn",
    edgecolor="black",
    linewidth=0.25,
    vmin=-4,
    vmax=4,
    legend_kwds={"format": FuncFormatter(lambda x, pos: f"{x:+.1f}%")},
)

ax.axis("off")
ax.set_title("PEP Data - Total Population Percentage Change by State, 2020-2021")
[23]:
Text(0.5, 1.0, 'PEP Data - Total Population Percentage Change by State, 2020-2021')
Part 3. Compare NY Results
[24]:
gdf_both_years[gdf_both_years.STATE == STATE_NY][
    ["NAME", TOTAL_POPULATION_CHANGE, TOTAL_POPULATION_CHANGE_PERCENT]
]
[24]:
| NAME | B01003_001E_DELTA | B01003_001E_DELTA_PERCENT | |
|---|---|---|---|
| 4 | New York | 599896 | 3.074049 |
[25]:
gdf_pep[gdf_pep.STATE == STATE_NY][["NAME", NUM_CHANGE_VARIABLE, PCT_CHANGE_VARIABLE]]
[25]:
| NAME | NPOPCHG_2021 | PPOPCHG_2021 | |
|---|---|---|---|
| 37 | New York | -319020 | -1.582838 |
[ ]: