Map Demo
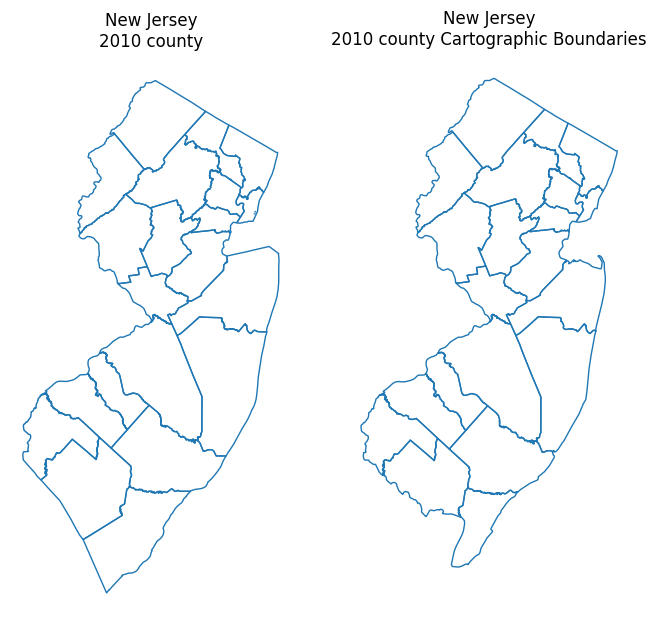
This demo is designed to show the difference in resolution and scope between the geometries returned by censusdis.maps.ShapeReader.read_shapefile and censusdis.maps.ShapeReader.read_cb_shapefile. The former returns high-resolution geometry focused on political boundaries that is useful for spatial joins. The latter returns lower resolution cartographic boundary geometries suitable for plotting maps.
Imports and configuration
[1]:
# So we can run from within the censusdis project and find the packages we need.
import os
import sys

sys.path.append(
    os.path.join(os.path.abspath(os.path.join(os.path.curdir, os.path.pardir)))
)
[2]:
from collections import OrderedDict

import matplotlib.pyplot as plt

from censusdis import states
from censusdis.maps import ShapeReader
[3]:
STATE = states.NJ
YEAR = 2010
Read the geometries
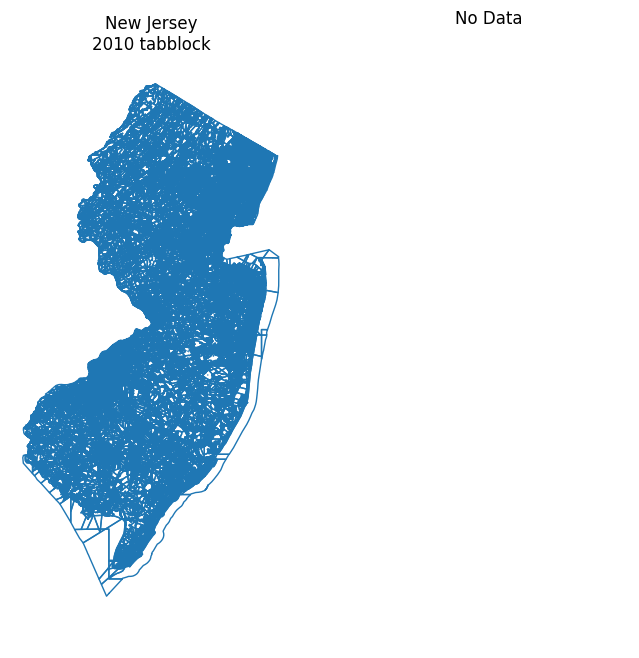
We will read both files for a variety of geoemetries. Note that blocks are quite small so there is no separate cartographic bounds version available.
[4]:
reader = ShapeReader(year=YEAR)
[5]:
shapefiles_by_geo = OrderedDict()
for geo in ["tabblock", "bg", "tract", "cousub"]:
    gdf = reader.read_shapefile(STATE, geo)
    shapefiles_by_geo[geo] = gdf
[6]:
cb_by_geo = {}
if YEAR >= 2010:
    for geo in ["bg", "tract", "cousub"]:
        gdf = reader.read_cb_shapefile(STATE, geo)
        cb_by_geo[geo] = gdf
Counties
County files are available on a nationwide basis, so we will load them that way and then filter down to just the state we want.
[7]:
gdf = reader.read_shapefile("us", "county")
shapefiles_by_geo["county"] = gdf[gdf["STATEFP"] == STATE]
[8]:
gdf_cb = reader.read_cb_shapefile("us", "county")
cb_by_geo["county"] = gdf_cb[gdf_cb["STATEFP"] == STATE]
Plot
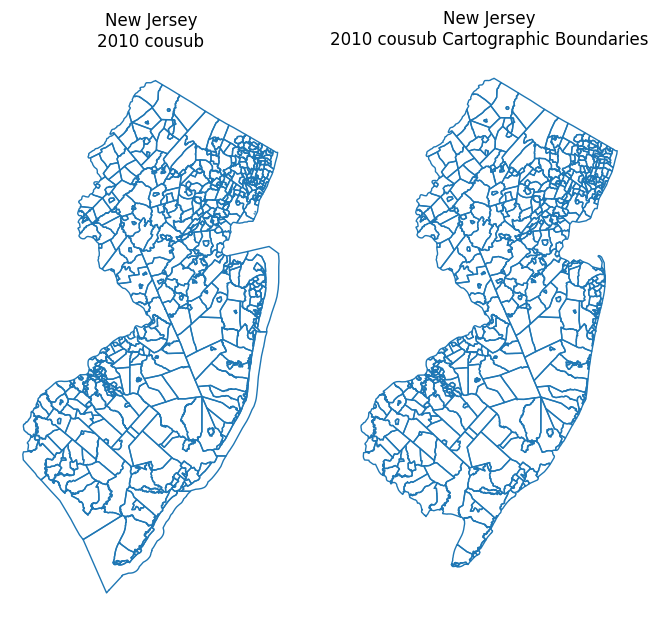
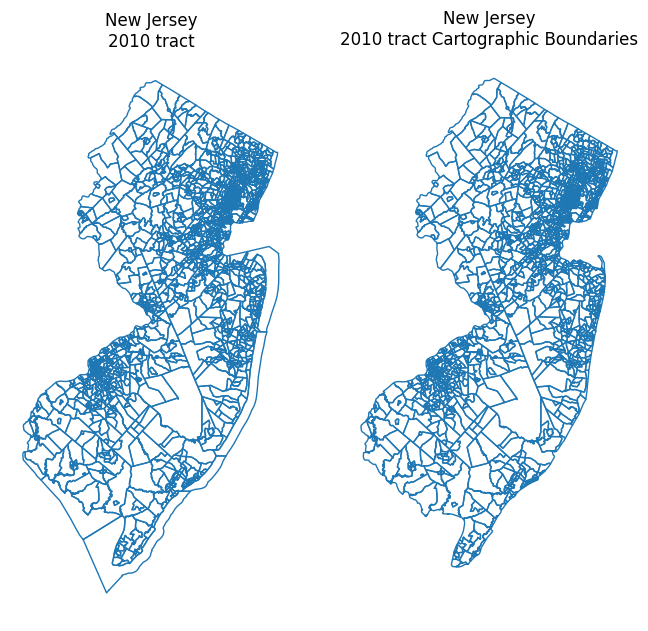
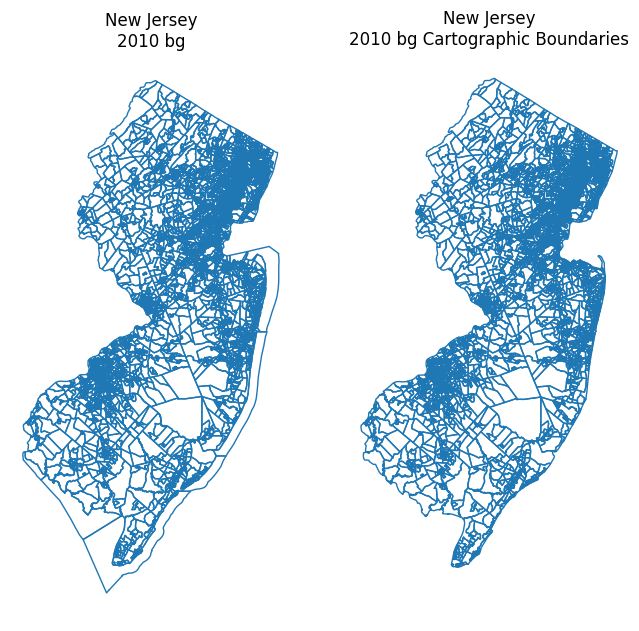
Now let’s plot each geometrty side by side. You will see that the cartographic boundary versions still have plenty of detail to render nice maps, and that they also don’t extend out into bodies of water like the other versions do when, for example, a county, county subdivision, or census tract includes water.
[9]:
def plot(gdf, state, geo_name, ax):
    ax = gdf.boundary.plot(linewidth=1, ax=ax)

    state_name = states.NAMES_FROM_IDS[state]

    ax.set_title(f"{state_name}\n{YEAR} {geo_name}")

    ax.axis("off")
[10]:
for geo, gdf_shape in reversed(shapefiles_by_geo.items()):
    fig, axes = plt.subplots(1, 2, sharey=True, figsize=(8, 8))
    plot(gdf_shape, STATE, geo, axes[0])
    gdf_cb = cb_by_geo.get(geo, None)
    if gdf_cb is not None:
        plot(gdf_cb, STATE, f"{geo} Cartographic Boundaries", axes[1])
    else:
        axes[1].set_title("No Data")
        axes[1].axis("off")
[ ]: