Map Geographies
This notebooks demonstrates some of the different geographies for which we can download shapefiles using the censusdis.maps.ShapeReader.read_cb_shapefile API.
These shapefiles are generally very useful for plotting. For even higher resolution shapefiles more suited for tasks like spatially joining data, the censusdis.maps.ShapeReader.read_shapefile API is available.
Imports and configuration
[1]:
# So we can run from within the censusdis project and find the packages we need.
import os
import sys

sys.path.append(
    os.path.join(os.path.abspath(os.path.join(os.path.curdir, os.path.pardir)))
)
[2]:
import os

import geopandas as gpd
import matplotlib.pyplot as plt

from typing import Iterable, Optional

from censusdis.states import STATE_NJ, STATE_AK, STATE_HI, ALL_STATES_AND_DC
from censusdis.maps import ShapeReader, plot_us_boundary
import censusdis.maps as cmap
[3]:
# We are going to provide a path for our shape file
# reader to cache the shapefiles it downloads locally.
# This is optional, and if we don't provide this when
# we construct the reader, a default location will be
# selected for us.
SHAPEFILE_ROOT = os.path.join(os.environ["HOME"], "data", "shapefiles")

# Make sure it is there.
os.makedirs(SHAPEFILE_ROOT, exist_ok=True)
[4]:
STATE = STATE_NJ
# For small geographies we may want to plot only one county.
COUNTY_ESSEX = "013"
YEAR = 2020
[5]:
reader = ShapeReader(SHAPEFILE_ROOT, YEAR)
[6]:
# For plotting the country so we can see where other
# geographies are in reference to states.
gdf_states = reader.read_cb_shapefile("us", "state")
gdf_states = gpd.GeoDataFrame(gdf_states[gdf_states.STATEFP.isin(ALL_STATES_AND_DC)])
[7]:
def plot(gdf, geo: str, in_geo: str):
    ax = gdf.boundary.plot(linewidth=0.5)

    ax.set_title(f"{YEAR} {geo} in {in_geo}")

    ax.axis("off")


def plot_usa(
    gdf,
    geo: str,
    in_geo: str = "the United States",
    *,
    plot_states: bool = True,
    state_filter: Optional[Iterable[str]] = None,
):
    if "STATEFP" in gdf.columns:
        gdf = gdf[gdf.STATEFP.isin(ALL_STATES_AND_DC)]

    ax = plot_us_boundary(gdf, linewidth=0.5)

    if plot_states:
        if state_filter is not None:
            gdf_plot_states = gdf_states[gdf_states.STATEFP.isin(state_filter)]
        else:
            gdf_plot_states = gdf_states

        ax = plot_us_boundary(gdf_plot_states, ax=ax, edgecolor="black", linewidth=0.5)

    ax.set_title(f"{YEAR} {geo} in {in_geo}")

    ax.axis("off")
Geographies within the State Level
These are smaller geographies for which we shapefiles are provided on a state-by-state basis. When we query them, we have to specify the state we are interested in.
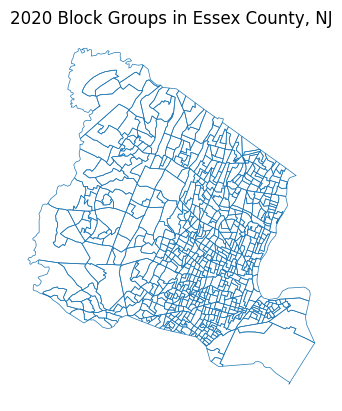
Block Groups (geography="bg")
[8]:
gdf = reader.read_cb_shapefile(STATE, "bg")
[9]:
plot(gdf[gdf.COUNTYFP == COUNTY_ESSEX], "Block Groups", "Essex County, NJ")
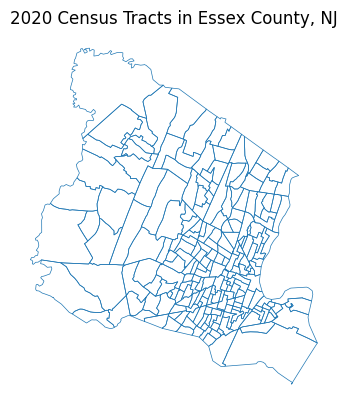
Census Tracts (geography="tract")
[10]:
gdf = reader.read_cb_shapefile(STATE, "tract")
[11]:
plot(gdf[gdf.COUNTYFP == COUNTY_ESSEX], "Census Tracts", "Essex County, NJ")
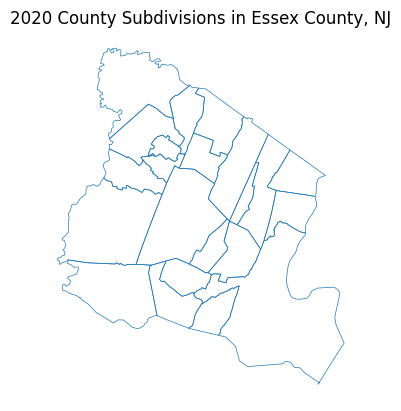
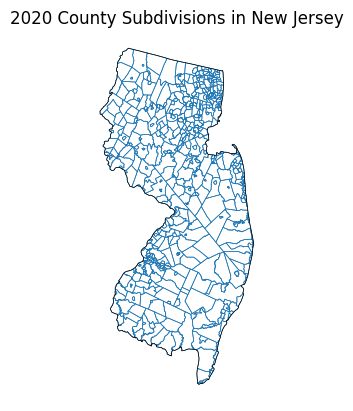
County Subdivisions (geography="cousub")
[12]:
gdf = reader.read_cb_shapefile(STATE, "cousub")
[13]:
plot(gdf[gdf.COUNTYFP == COUNTY_ESSEX], "County Subdivisions", "Essex County, NJ")
[14]:
plot_usa(gdf, "County Subdivisions", "New Jersey", state_filter=[STATE_NJ])
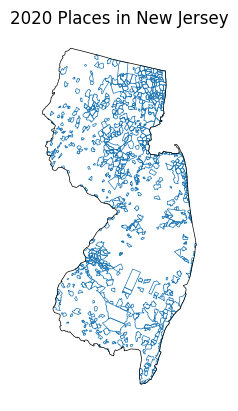
Places (geography="place")
[15]:
gdf = reader.read_cb_shapefile(STATE, "place")
[16]:
plot_usa(gdf, "Places", "New Jersey", state_filter=[STATE_NJ])
State and Sub-State Geographies Queried at the National Level
Each of these geographies is entirely enclosed in a single state, but there are few enough of them that they are published in a single shapefile for the whole country. For these, we specify "us" instead of a state as the first argument to our query.
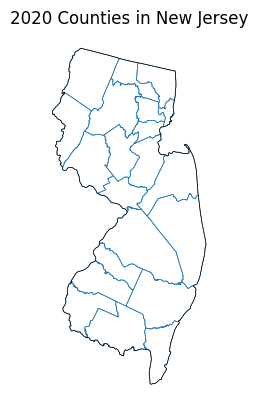
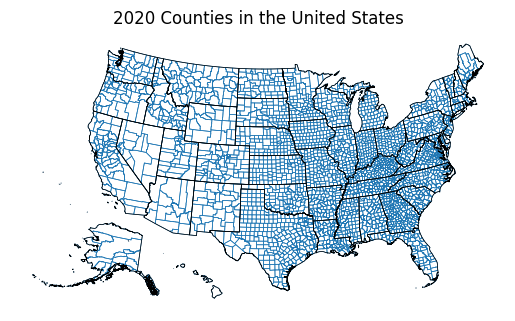
Counties (geography="county")
[17]:
gdf = reader.read_cb_shapefile("us", "county")
[18]:
plot_usa(
    gdf[gdf.STATEFP == STATE_NJ], "Counties", "New Jersey", state_filter=[STATE_NJ]
)
[19]:
plot_usa(gdf, "Counties")
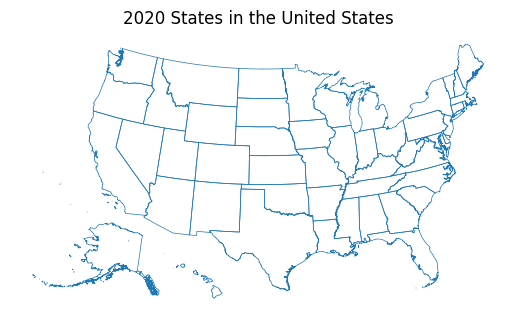
States (geography="state")
[20]:
gdf = reader.read_cb_shapefile("us", "state")
[21]:
plot_usa(gdf, "States", plot_states=False)
Top-Level Geographies not Contained in Any State
These geographies are queried at the national level. They do not belong to any particular state and don’t have any column like STATEFP that associates them with a state.
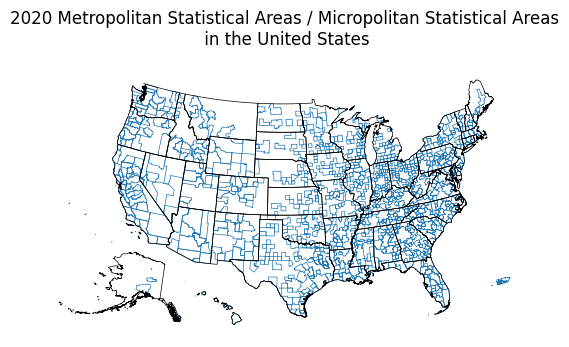
Metropolitan Statistical Areas / Micropolitan Statistical Areas (geography="cbsa")
[22]:
gdf = reader.read_cb_shapefile("us", "cbsa")
[23]:
plot_usa(gdf, "Metropolitan Statistical Areas / Micropolitan Statistical Areas\n")
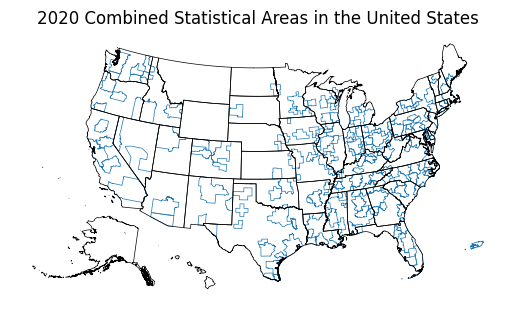
Combined Statistical Areas (geography="csa")
[24]:
gdf = reader.read_cb_shapefile("us", "csa")
[25]:
plot_usa(gdf, "Combined Statistical Areas")
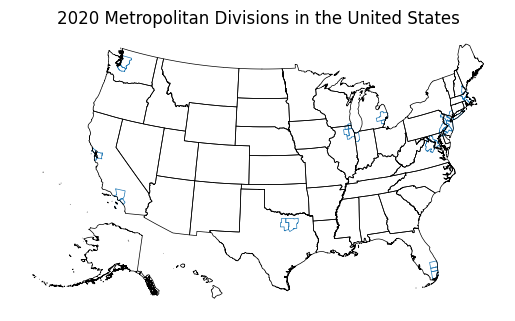
Metropolitan Divisions (geography="metdiv")
[26]:
gdf = reader.read_cb_shapefile("us", "metdiv")
[27]:
plot_usa(gdf, "Metropolitan Divisions")
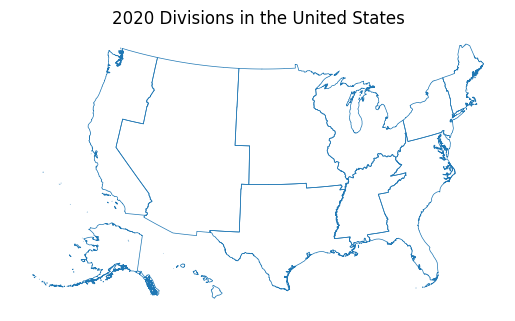
Divisions (geography="division")
[28]:
gdf = reader.read_cb_shapefile("us", "division")
[29]:
plot_usa(gdf, "Divisions", plot_states=False)
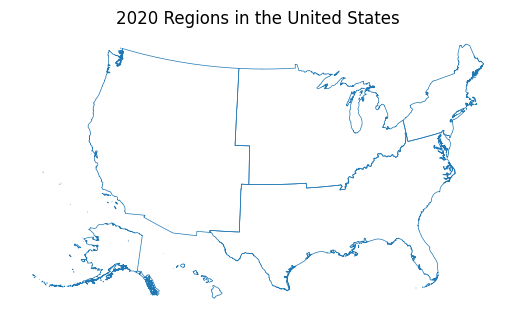
Regions (geography="region")
[30]:
gdf = reader.read_cb_shapefile("us", "region")
[31]:
plot_usa(gdf, "Regions", plot_states=False)
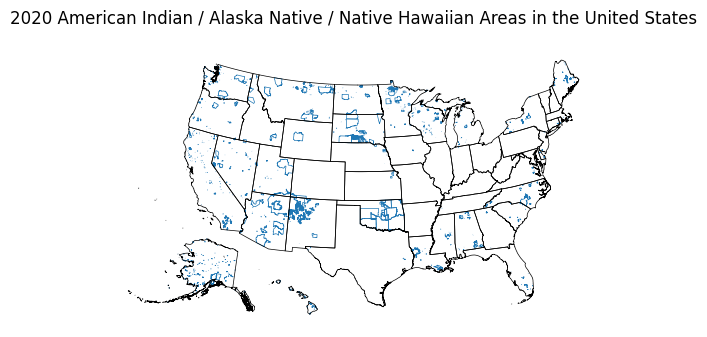
American Indian / Alaska Native / Native Hawaiian Areas (geography="aiannh")
[32]:
gdf = reader.read_cb_shapefile("us", "aiannh")
[33]:
plot_usa(gdf, "American Indian / Alaska Native / Native Hawaiian Areas")
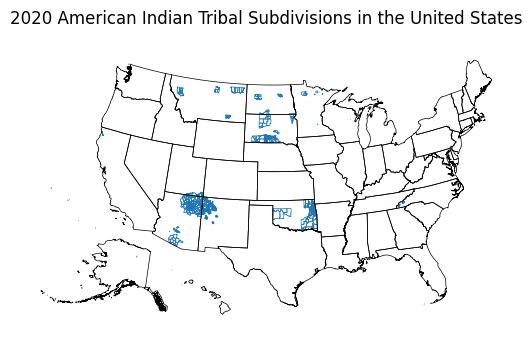
American Indian Tribal Subdivisions (geography="aitsn")
[34]:
gdf = reader.read_cb_shapefile("us", "aitsn")
[35]:
plot_usa(gdf, "American Indian Tribal Subdivisions")
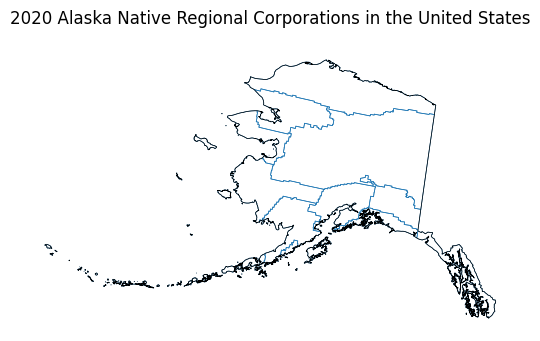
Alaska Native Regional Corporations ((geography="anrc")
[36]:
# An atypical naming convention is used here for the first
# arg.
gdf = reader.read_cb_shapefile("02", "anrc")
[37]:
plot_usa(gdf, "Alaska Native Regional Corporations", state_filter=[STATE_AK])
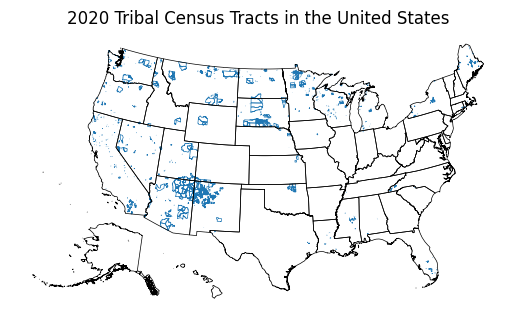
Tribal Census Tracts (geography="ttract")
[38]:
gdf = reader.read_cb_shapefile("us", "ttract")
[39]:
plot_usa(gdf, "Tribal Census Tracts")
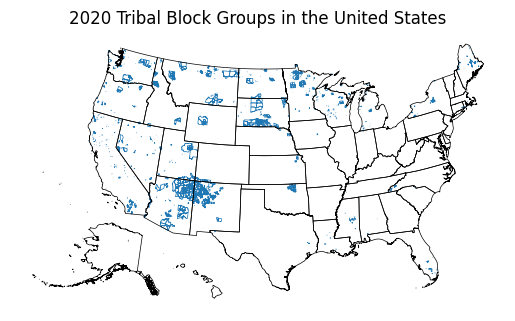
Tribal Block Groups (geography="tbg")
[40]:
gdf = reader.read_cb_shapefile("us", "tbg")
[41]:
plot_usa(gdf, "Tribal Block Groups")
[ ]: