Population Change 2020-2021
This notebook demonstrates how to query and merge the same data set from different years. It also demonstrates how, behind the scenes, censusdis loads metadata and works across multiple years. Nothing is hard-coded in the library about what variables or data sets are available in what years. So when the 2021 data was published, this notebook just worked.
[1]:
# So we can run from within the censusdis project and find the packages we need.
import os
import sys

sys.path.append(
    os.path.join(os.path.abspath(os.path.join(os.path.curdir, os.path.pardir)))
)
Imports and configuration
[2]:
import censusdis.data as ced
import censusdis.maps as cem
[3]:
DATASET = "acs/acs5"
[4]:
TOTAL_POPULATION_VARIABLE = "B01003_001E"
Download the popluation of the states in both years
[5]:
gdf_states_2020 = ced.download_detail(
    DATASET, 2020, ["NAME", TOTAL_POPULATION_VARIABLE], state="*", with_geometry=True
)

# Note that we don't load the geometry here.
# We already have it above, and it will
# still be available after the merge.
df_states_2021 = ced.download_detail(
    DATASET, 2021, ["NAME", TOTAL_POPULATION_VARIABLE], state="*"
)
Merge the two data sets and compute how the populations changed
[6]:
gdf_both_years = gdf_states_2020.merge(
    df_states_2021, on=["STATE", "NAME"], suffixes=("_2020", "_2021")
)
[7]:
TOTAL_POPULATION_2020_VARIABLE = f"{TOTAL_POPULATION_VARIABLE}_2020"
TOTAL_POPULATION_2021_VARIABLE = f"{TOTAL_POPULATION_VARIABLE}_2021"

TOTAL_POPULATION_CHANGE = f"{TOTAL_POPULATION_VARIABLE}_DELTA"
TOTAL_POPULATION_CHANGE_PERCENT = f"{TOTAL_POPULATION_CHANGE}_PERCENT"
[8]:
gdf_both_years[TOTAL_POPULATION_CHANGE] = (
    gdf_both_years[TOTAL_POPULATION_2021_VARIABLE]
    - gdf_both_years[TOTAL_POPULATION_2020_VARIABLE]
)

gdf_both_years[TOTAL_POPULATION_CHANGE_PERCENT] = (
    100
    * gdf_both_years[TOTAL_POPULATION_CHANGE]
    / gdf_both_years[TOTAL_POPULATION_2020_VARIABLE]
)
Fastest growing states
Absolute
[9]:
gdf_both_years.sort_values(TOTAL_POPULATION_CHANGE, ascending=False)[
    ["NAME", TOTAL_POPULATION_CHANGE]
].head()
[9]:
| NAME | B01003_001E_DELTA | |
|---|---|---|
| 4 | New York | 599896 |
| 29 | New Jersey | 348606 |
| 24 | Texas | 227139 |
| 0 | Pennsylvania | 175765 |
| 7 | Florida | 122838 |
Percentagewise
[10]:
gdf_both_years.sort_values(TOTAL_POPULATION_CHANGE_PERCENT, ascending=False)[
    ["NAME", TOTAL_POPULATION_CHANGE_PERCENT]
].head()
[10]:
| NAME | B01003_001E_DELTA_PERCENT | |
|---|---|---|
| 29 | New Jersey | 3.923349 |
| 19 | Idaho | 3.263285 |
| 42 | Rhode Island | 3.228499 |
| 4 | New York | 3.074049 |
| 32 | Vermont | 2.770446 |
Fastest shrinking states
Absolute
[11]:
gdf_both_years.sort_values(TOTAL_POPULATION_CHANGE, ascending=True)[
    ["NAME", TOTAL_POPULATION_CHANGE]
].head()
[11]:
| NAME | B01003_001E_DELTA | |
|---|---|---|
| 16 | Arizona | -94861 |
| 33 | North Carolina | -19205 |
| 5 | District of Columbia | -18820 |
| 39 | Mississippi | -14812 |
| 8 | South Carolina | -12614 |
Percentagewise
[12]:
gdf_both_years.sort_values(TOTAL_POPULATION_CHANGE_PERCENT, ascending=True)[
    ["NAME", TOTAL_POPULATION_CHANGE_PERCENT]
].head()
[12]:
| NAME | B01003_001E_DELTA_PERCENT | |
|---|---|---|
| 5 | District of Columbia | -2.681011 |
| 16 | Arizona | -1.322277 |
| 15 | Wyoming | -0.809670 |
| 39 | Mississippi | -0.496741 |
| 2 | West Virginia | -0.352822 |
Plot on maps
[13]:
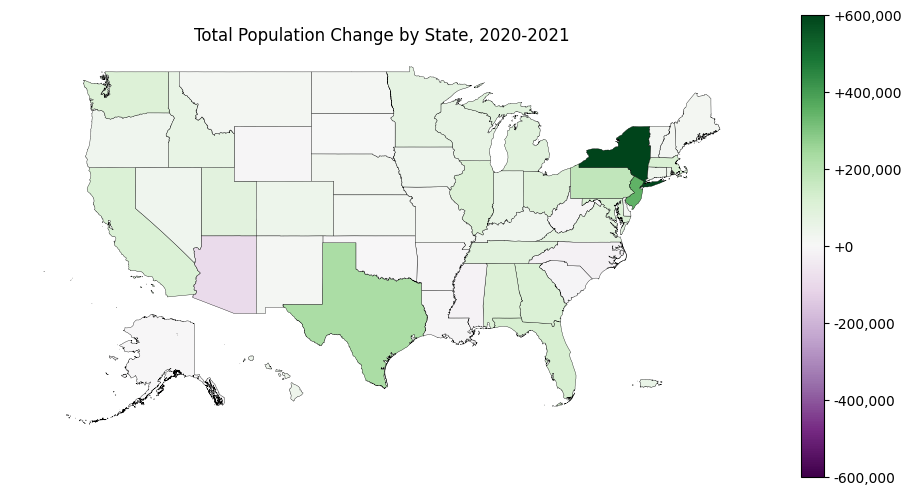
from matplotlib.ticker import FuncFormatter

ax = cem.plot_us(
    gdf_both_years,
    TOTAL_POPULATION_CHANGE,
    legend=True,
    figsize=(12, 6),
    cmap="PRGn",
    edgecolor="black",
    linewidth=0.25,
    vmin=-600_000,
    vmax=600_000,
    legend_kwds={"format": FuncFormatter(lambda x, pos: f"{x:+,.0f}")},
)

ax.axis("off")
ax.set_title("Total Population Change by State, 2020-2021")
[13]:
Text(0.5, 1.0, 'Total Population Change by State, 2020-2021')
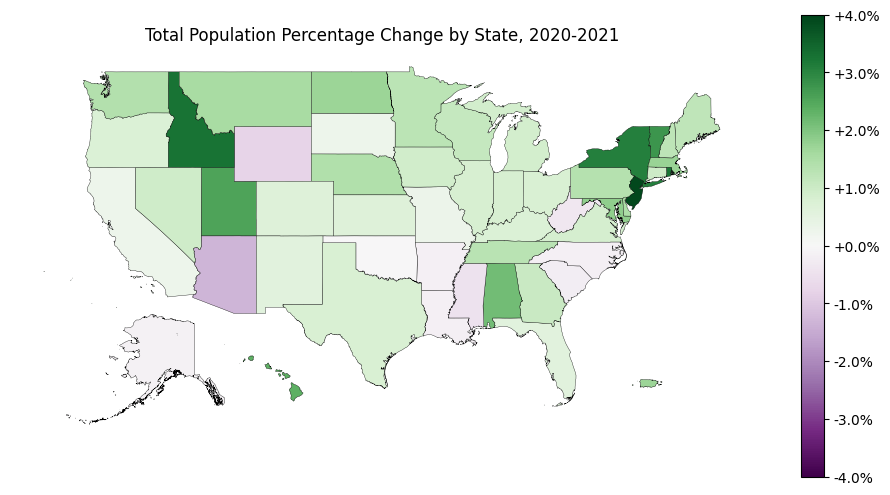
[14]:
ax = cem.plot_us(
    gdf_both_years,
    TOTAL_POPULATION_CHANGE_PERCENT,
    legend=True,
    figsize=(12, 6),
    cmap="PRGn",
    edgecolor="black",
    linewidth=0.25,
    vmin=-4,
    vmax=4,
    legend_kwds={"format": FuncFormatter(lambda x, pos: f"{x:+.1f}%")},
)

ax.axis("off")
ax.set_title("Total Population Percentage Change by State, 2020-2021")
[14]:
Text(0.5, 1.0, 'Total Population Percentage Change by State, 2020-2021')
[ ]: